
Public Analytics Dashboards for MLS/NWSL

I really did plan to have a regular update schedule for this little blog, but unfortunately life decided to intervene and make things difficult for me. In my defense, my wife and I started taking care of a newborn baby a little over a month ago.
I do plan on talking about non soccer things from time to time, and I guess it makes sense for this to do it now. My wife and I are foster parents. We’ve been licensed for a bit more than 6 years and in the time since have usually had at least one placement in the house. Our oldest child was adopted from foster care, and was also our first placement (also our first kid - we’ve had two biological kids since, but she came before either of them.) There’s a lot out there in the universe about foster parenting, and most of it negative, but for us it has been extremely rewarding.
This is our first time fostering a newborn - we’ve had babies before, but none younger than 8 months. It was a strange experience jumping right back into the newborn stage. Usually you get about 8 months to plan for a new baby; you have time to acquire all the various things you need. You also get to mentally prepare for the sleepless nights, not to mention planning ahead for parental leave. Friends and family have time to get excited for you, and everyone basically understands that a time is coming when you’re going to be unavailable.
With foster parenting you get none of that. We agreed to the placement on a Friday and he was moved in on Monday at just two weeks old. Naturally that has meant hobbies have taken a back burner. I have tried to keep up as much as possible, but any sort of writing has naturally had to fall by the wayside.
I’ll probably write more about parenting in here; it takes up a tremendous amount of my time and energy, and while I’ve been cautious about putting that side of my life on the internet I think there’s value in hearing lots of perspectives.
Jumping right back into the soccer:
I’ve been working on a Tableau dashboard since the start of the season. Coming into the year, I’d been working with event data and had a few different dashboards that focused on players, teams, and games. I do sometimes have trouble self editing and not putting too much information out there, but I also like a number of different ways of looking at the game and understanding how teams play. Towards the end of last season, though, it became a little too cumbersome to update and monitor that many things; plus, the file sizes and load times were starting to get insane.
This year I’ve focused more heavily on efficiency and trying to highlight the most important information. I’ve gotten these dashboards into a place where I am happy with what’s being presented. It’s still an incredible amount of information, with a great deal of depth, but the most important ideas are available at a glance. It’s also still a bit of a work in progress. I’m 90% of the way there but there’s always improvements to be made. The last 10% is often the hardest for me, so rather than agonize over details before making the dashboards public I’m just going to throw it out there.
Please note that while I did take the time to make these readable on mobile, the ideal way to access these is via desktop.
Here’s a brief overview of some of what you’ll find in there, but I am working on a glossary too. Keep in mind any blue box is clickable and takes you to a different page of the dashboard.
Team Metrics:
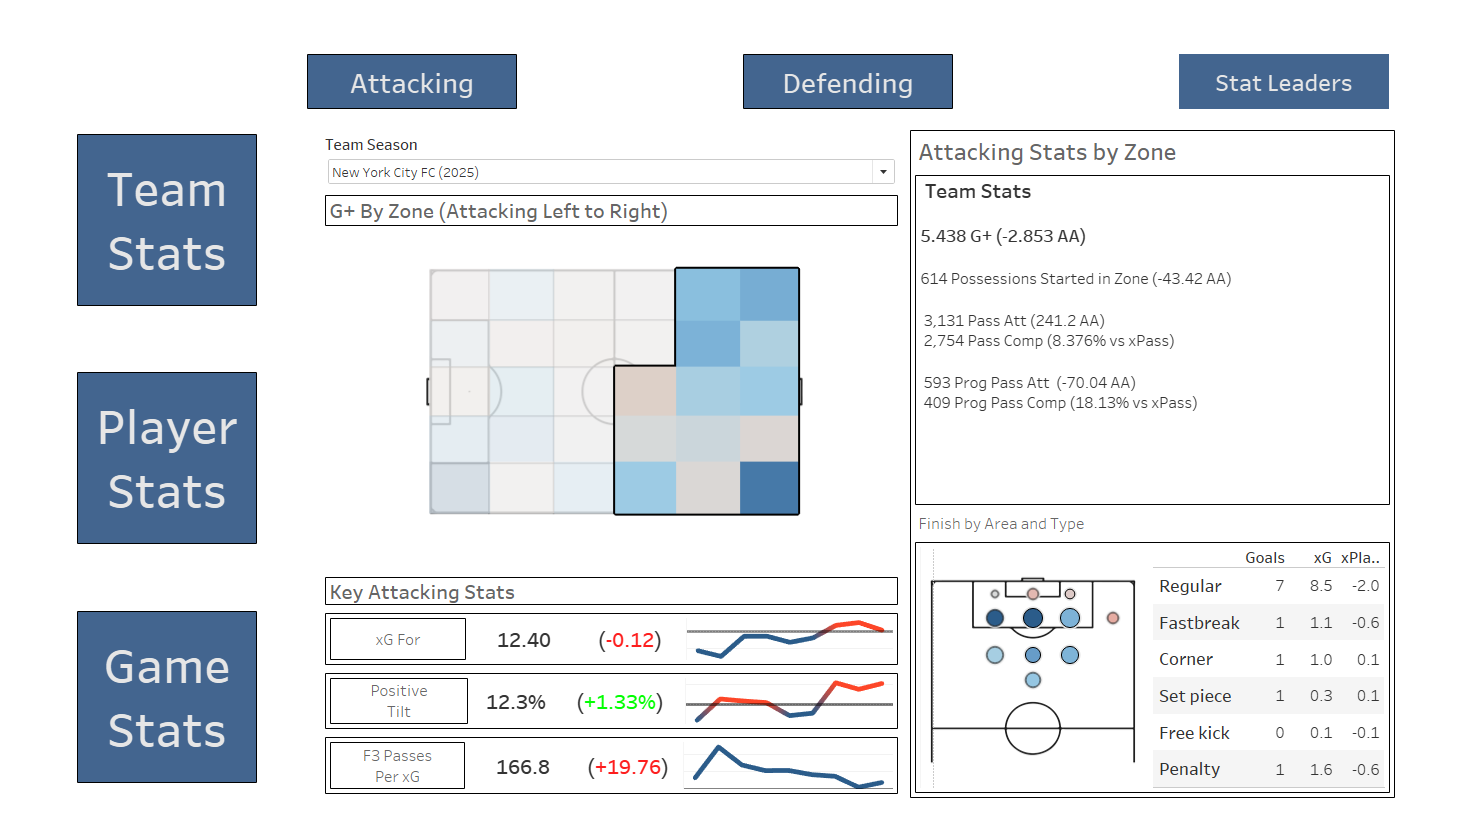
These track performances against underlying metrics such as xG, field tilt, and attacking/defensive efficiency. I try whenever possible to include measurements against the average team in the league. Whenever you see AA, that means above average given the same amount of games (or minutes when it’s a player)
One of the cool things here is the zonal breakdown of attacking and defending metrics. You can highlight one or multiple zones and the numbers in the box on the right will update to solely reflect those zones.
Player Metrics
Field Players:
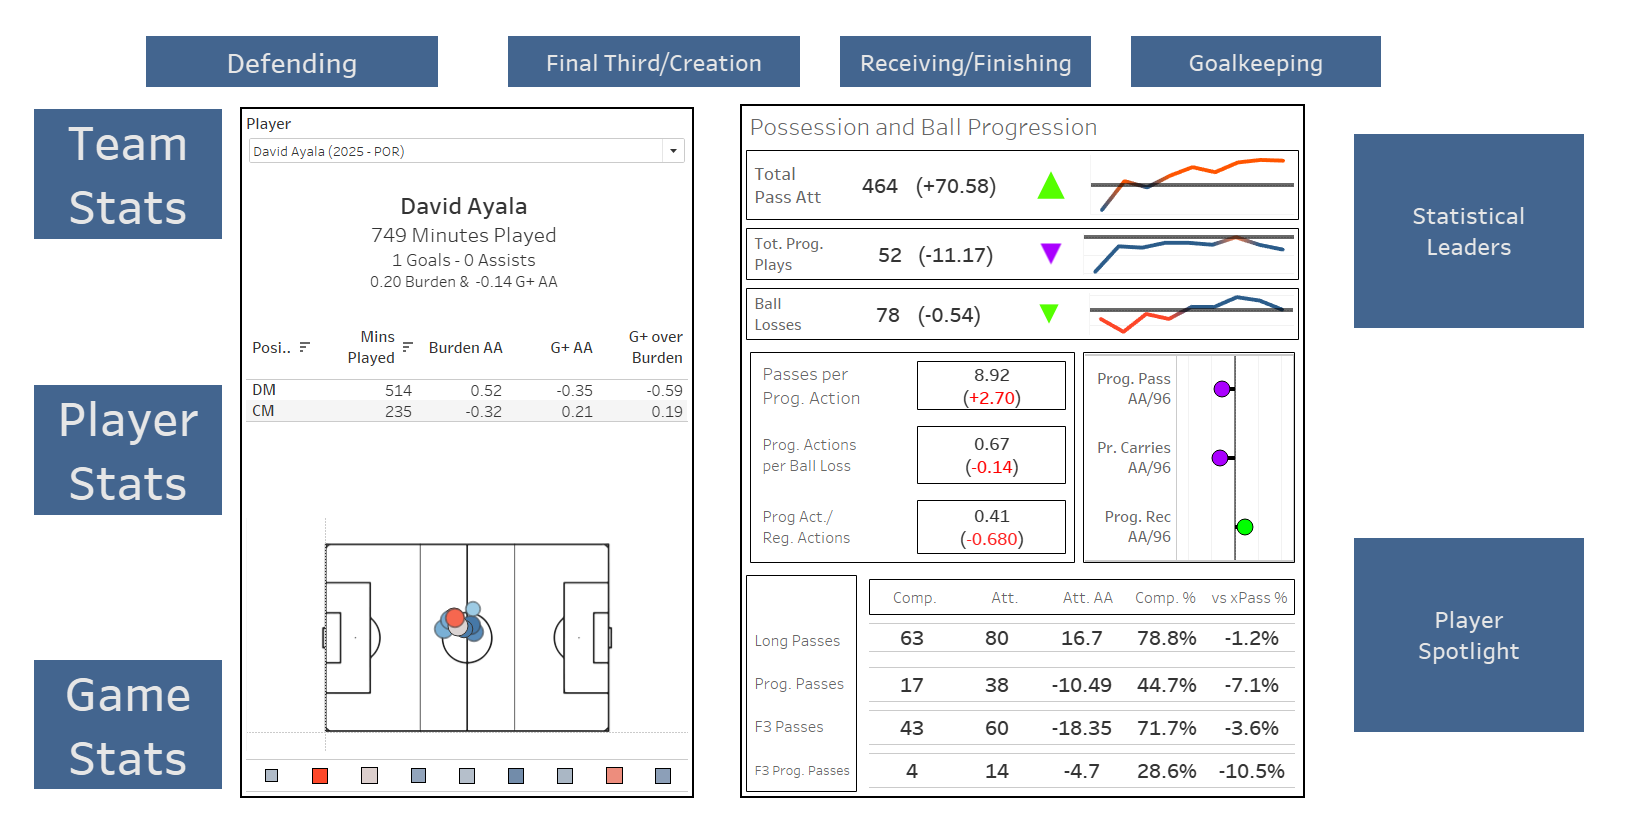
I have these broken up into multiple different domains, each focusing on some of the different tasks a player needs to do while on the field. Obviously this can be different depending on the players’ positions. Performances vs average are based per game by the position the player was in, much how G+ is calculated in the American Soccer Analysis App. (Note - my G+ numbers are going to be slightly different; they’re offense only)
Goalkeeping:
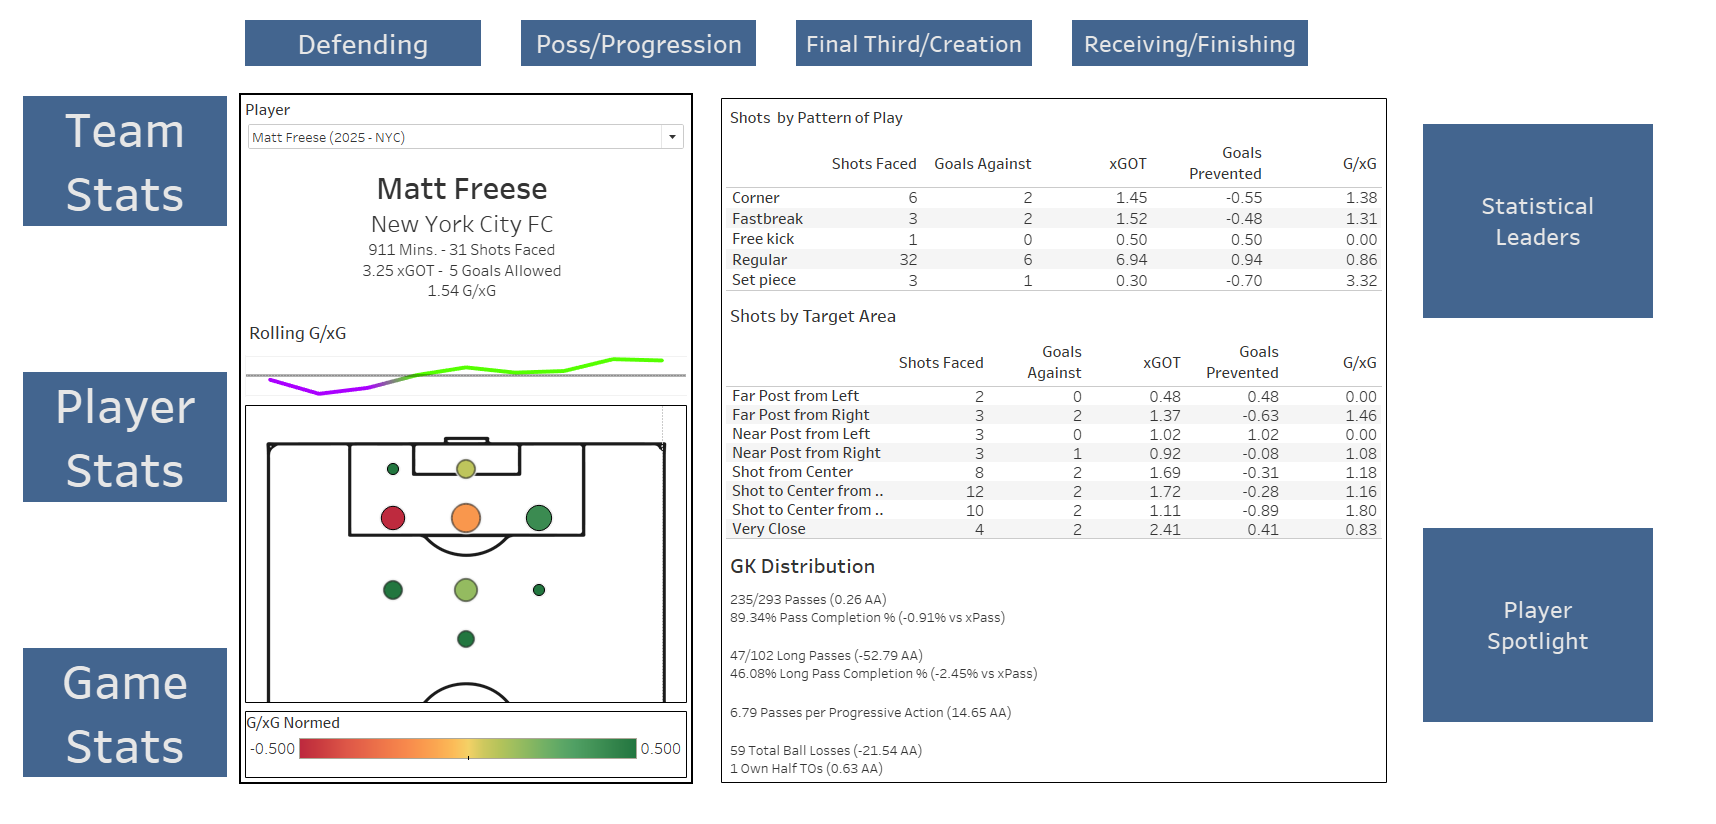
Goalkeepers get their own separate page. Included is a detailed breakdown of where the shots they are facing are coming from. Hovering over one of the dots on the shot map will provide a goal mouth map as well.
Game Metrics:
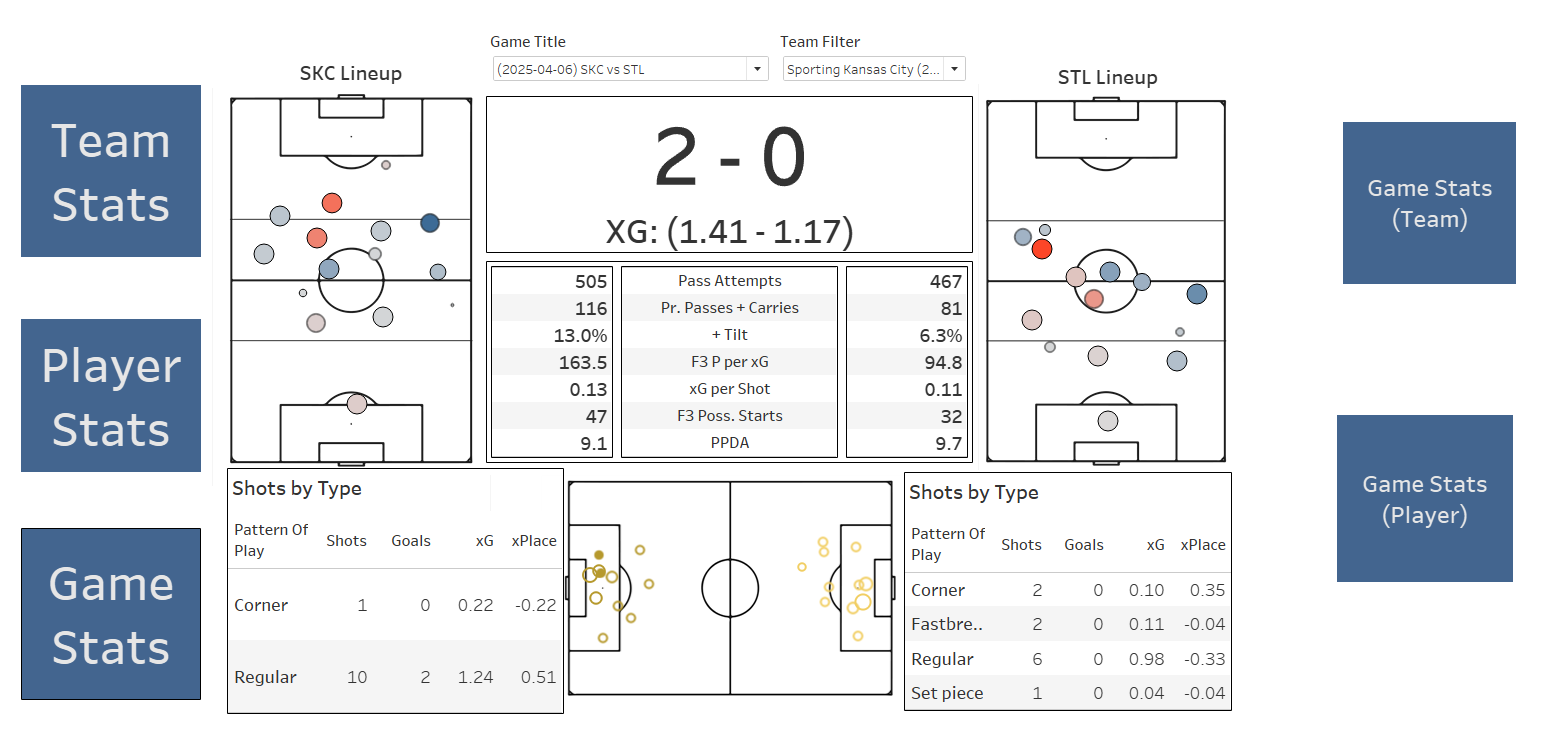
I don’t think there’s anything ground breaking here, but it does keep everything in one place.
Update Schedule:
Because Tableau Public can be a bear to work with, this does have a bit of work to do each week to manually update the dashboards. For that reason, I’ll only update it weekly. On my Tableau profile are USLC and MLS Next Pro dashboards that I may update as well, though maybe not as frequently.
Anyway, my hope is that this can be a resource for anyone who really wants to dive into what the numbers are saying about the leagues they follow. It may be way too much information to parse through but I think there’s some valuable stuff for anyone who really digs into it.